#1
Busiest cargo airport in the world, serving 27 markets with non-stop service.
LEARN MORE
There have always been major OEM companies within a 150-Mile radius and with a top U.S. automobile company building its flagship electric vehicle plant an hour from downtown Memphis, the future is ours.
Get a snapshot of Memphis's innovative automotive and electronic vehicle manufacturing sector.
SEE FULL REPORT80%
industry GRP growth, $3.7B in 2023
45%
Among top 10 fastest growing regions for Auto Manufacturing
25YRS
on the Fortune 500: Autozone
The Greater Memphis Area has seen robust growth in the automotive industry-driven GRP. Relative to 2022, automobiles have contributed $3.7 billion to GRP to the area. The 81.50% ten-year cumulative growth is driven mostly by auto part retail and auto manufacturing. Several large, new developments in electric vehicle manufacturing will continue to drive aggressive GRP growth in the coming years.
| Industry Presence | 2018 Jobs | 2023 Jobs | 2028 Jobs | Job Growth % (2018 - 2023) | Projected Job Growth % (2023 - 2028) | 2023 Location Quotient |
|---|---|---|---|---|---|---|
| Automotive Parts and Accessories Retailers | 3,315 | 4,004 | 4.326 | 20.8% | 8.0% | 2.52 |
| New Car Dealers | 4,018 | 3,787 | 3,714 | -5.7% | -1.9% | 0.85 |
| Motor Vehicle Supplies and New Parts Merchant Wholesalers | 1,979 | 2,043 | 2,046 | 3.2% | 0.1% | 2.80 |
| Automotive Mechanical and Electrical Repair and Maintenance | 1,608 | 1,636 | 1,693 | 1.8% | 3.5% | 0.93 |
| Other Automotive Repair and Maintenance | 842 | 1,153 | 1,266 | 36.8% | 9.8% | 1.01 |
| Automotive Body, Paint, Interior, and Glass Repair | 1,057 | 1,088 | 1,076 | 2.9% | -1.1% | 0.92 |
| Motor Vehicle Transmission and Power Train Parts Manufacturing | 1772 | 1,081 | 1,187 | 40.1% | 9.8% | 3.41 |
| Used Car Dealers | 1,137 | 1,013 | 987 | -10.9% | -2.6% | 1.47 |
| Tire Dealers | 1,094 | 893 | 908 | -18.4% | 1.7% | 1.17 |
| Electronic and Precision Equipment Repair and Maintenance | 878 | 621 | 515 | -29.2% | -17.2% | 1.46 |
| Top 10 Industry Total | 16,701 | 17,320 | 17,718 | 3.7% | 2.3% | |
| Automotive Industry Total | 18,454 | 18,738 | 19,138 | 1.5% | 2.1% |
| Industry Presence | 2018 Jobs | 2023 Jobs | 2028 Jobs | Job Growth % (2018 - 2023) | Projected Job Growth % (2023 - 2028) | 2023 Location Quotient |
|---|---|---|---|---|---|---|
Note: Above industries reflect 5-digit NAICS industries within the Memphis TN-MS-AR Metropolitan Area. Employment estimates derived from Lightcast Q4 2024 dataset QCEW Employment.
Location quotient (LQ) is a way of quantifying how concentrated a characteristic of a particular region is compared to the nation. These characteristics could be an industry’s or occupation’s share of employment, resident demographic, online profiles or job postings. The LQ is the calculation that reveals what makes that particular region “unique” in comparison to the national average. For example, if an industry in Greater Memphis accounts for 2.5% of regional jobs but only 1% of jobs nationally, then Greater Memphis has an LQ of 2.5, which means that this industry is 2.5x more concentrated in the region than the typical region.
| Occupation Description | 2018 Jobs | 2023 Jobs | 2028 Jobs | Job Growth % (2018 - 2023) | Projected Job Growth % (2023 - 2028) | 2023 Location Quotient |
|---|---|---|---|---|---|---|
| Miscellaneous Assemblers and Fabricators | 5,256 | 5,609 | 5,546 | 6.7% | -1.1% | 0.94 |
| Automotive Service Technicians and Mechanics | 3,277 | 2,965 | 3,067 | -9.5% | 3.4% | 1.08 |
| First-Line Supervisors of Mechanics, Installers, and Repairers | 1,736 | 2,307 | 2,414 | 29.2% | 4.6% | 0.98 |
| Cleaners of Vehicles and Equipment | 1,535 | 1,489 | 1,576 | -3.0% | 5.8% | 1.00 |
| Bus and Truck Mechanics and Diesel Engine Specialists | 1,395 | 1,377 | 1,438 | -1.3% | 4.4% | 1.20 |
| Parts Salesperson | 1,216 | 985 | 1,067 | -19.0% | 8.4% | 0.93 |
| Automotive Body and Related Repairers | 606 | 647 | 646 | 6.9% | -0.2% | 1.05 |
| Tire Repairers and Changers | 604 | 493 | 531 | -18.4% | 7.8% | 1.19 |
| Coating, Painting, and Spraying Machine Setters | 498 | 470 | 490 | -5.5% | 4.3% | 0.75 |
| Engine and Other Machine Assemblers | 554 | 279 | 288 | -49.6% | 3.1% | 1.26 |
| Top 10 Automotive Occupations Total | 16,726 | 16,621 | 17,063 | -0.6% | 2.7% |
| Occupation Description | 2018 Jobs | 2023 Jobs | 2028 Jobs | Job Growth % (2018 - 2023) | Projected Job Growth % (2023 - 2028) | 2023 Location Quotient |
|---|---|---|---|---|---|---|
Note: Above occupations reflect Standard Occupational Classifications (SOC codes) within the Memphis TN-MS-AR Metropolitan Area. Estimates derived from Lightcast, Q4 2024 dataset QCEW Employment.
Location quotient (LQ) is a way of quantifying how concentrated a characteristic of a particular region is compared to the nation. These characteristics could be an industry’s or occupation’s share of employment, resident demographic, online profiles or job postings. The LQ is the calculation that reveals what makes that particular region “unique” in comparison to the national average. For example, if an industry in Greater Memphis accounts for 2.5% of regional jobs but only 1% of jobs nationally, then Greater Memphis has an LQ of 2.5, which means that this industry is 2.5x more concentrated in the region than the typical region.
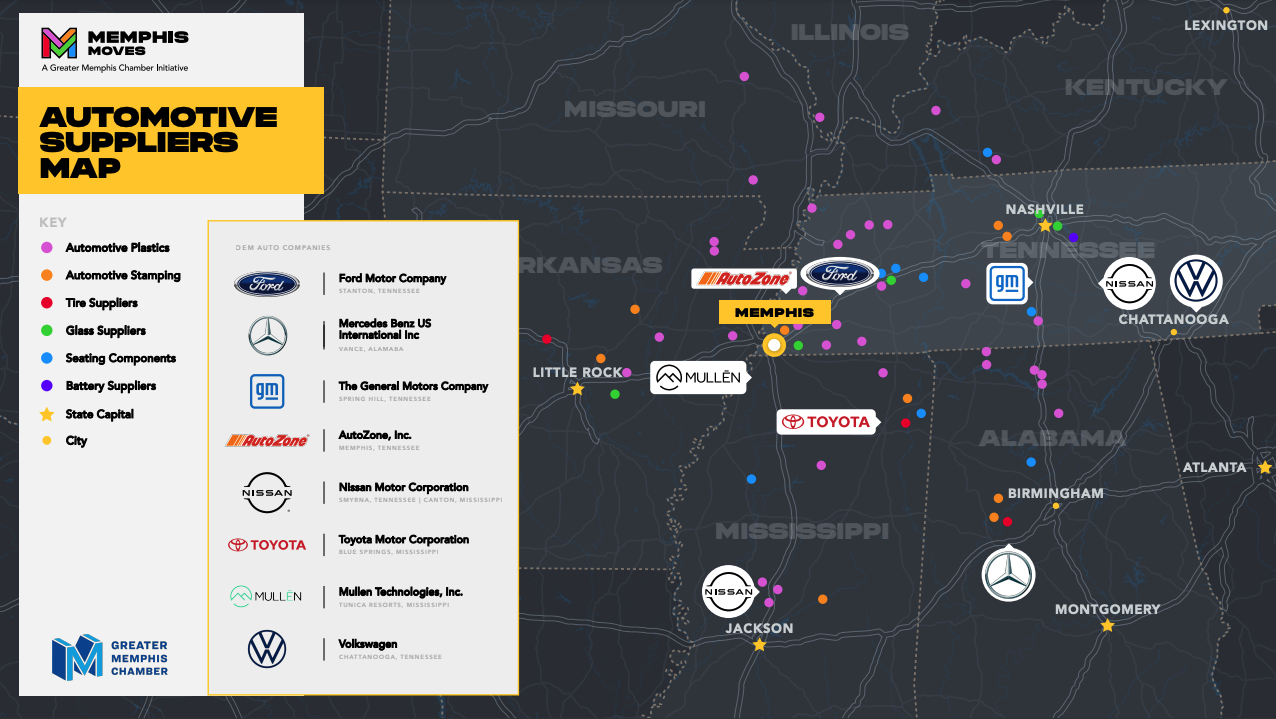
Memphis Automotive Suppliers Map